Sign up today for a free trial or get Excelitte deployed to your company's computer servers to protect all users' data and sensitive files in the following manner:
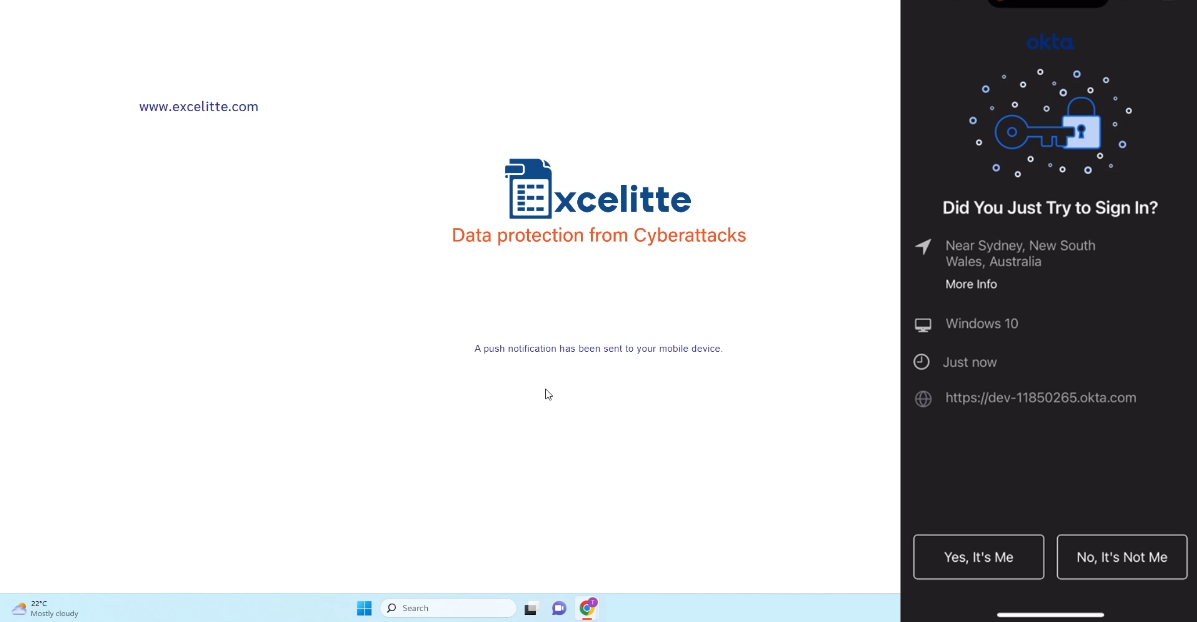
- Step 1 - Log into Excelitte using 3-Factor Authentication
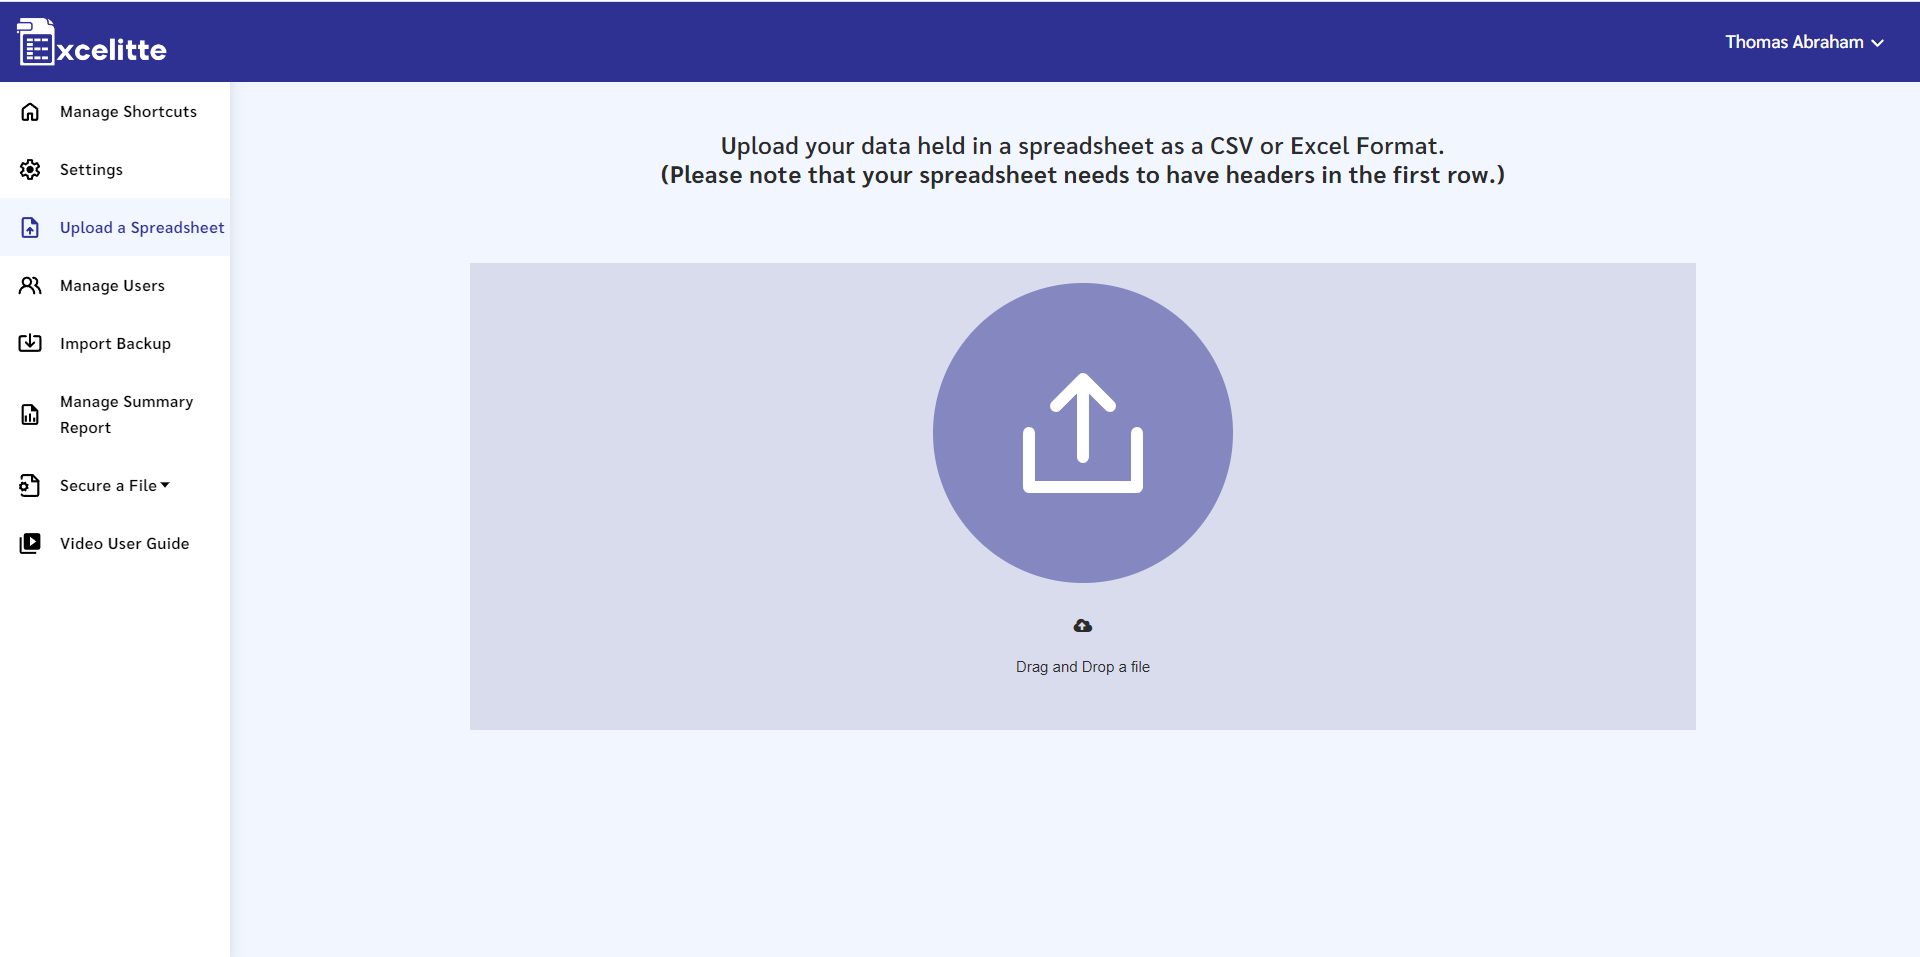
- Step 2 - Import any sensitive data held in spreadsheets in seconds, which will now be secured by the highest levels of encryption ensuring that the data can't now be hacked or stolen and is recoverable if stolen or maliciously deleted.
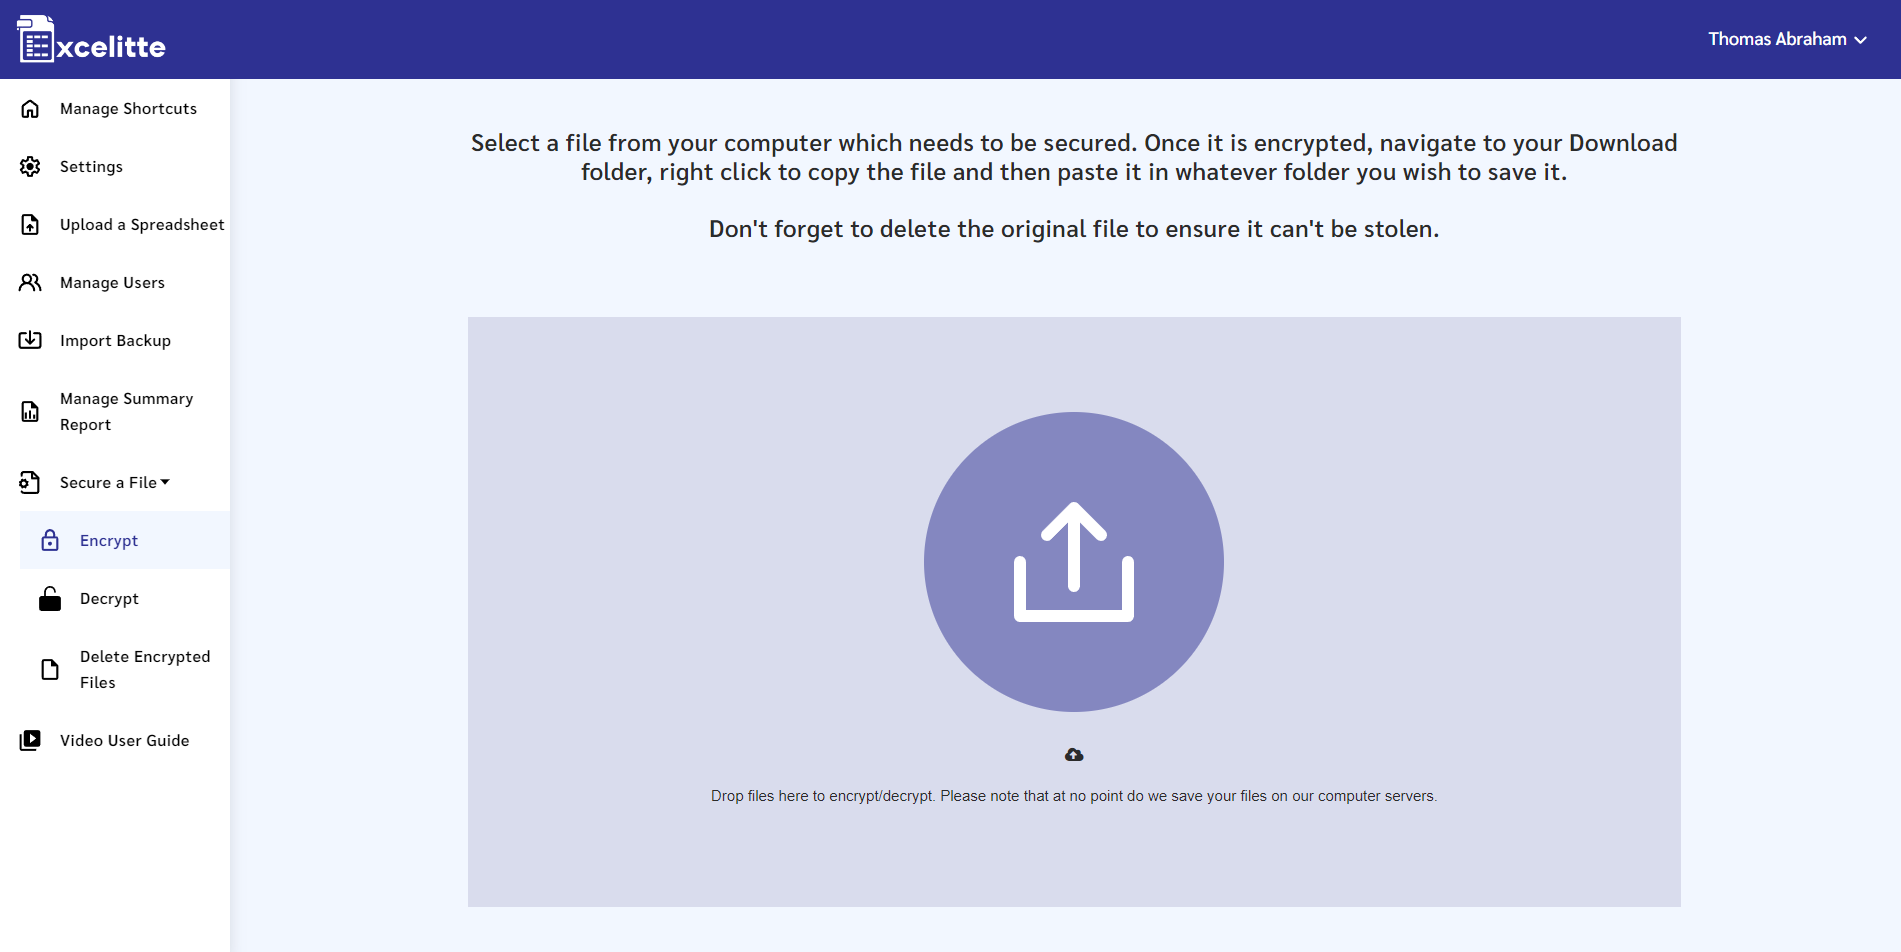
- Step 3 - Literally drag & drop all sensitive files into Excelitte, and they will now be encrypted, which will provide 100% security from all cyber theft
Note that all encrypted files and data are automatically backed up weekly and sent to the user via email, which means data can never be lost and is always recoverable.
All data is encrypted both during transmission and at rest, which means that all data can only be viewed by only the authenticated user, and not even the Excelitte team can view data held in excelitte even if they had access to the host server.
Once logged into your Excelitte account, click on the ‘Upload a Spreadsheet’ page and walk through the step-by-step instructions for each section.
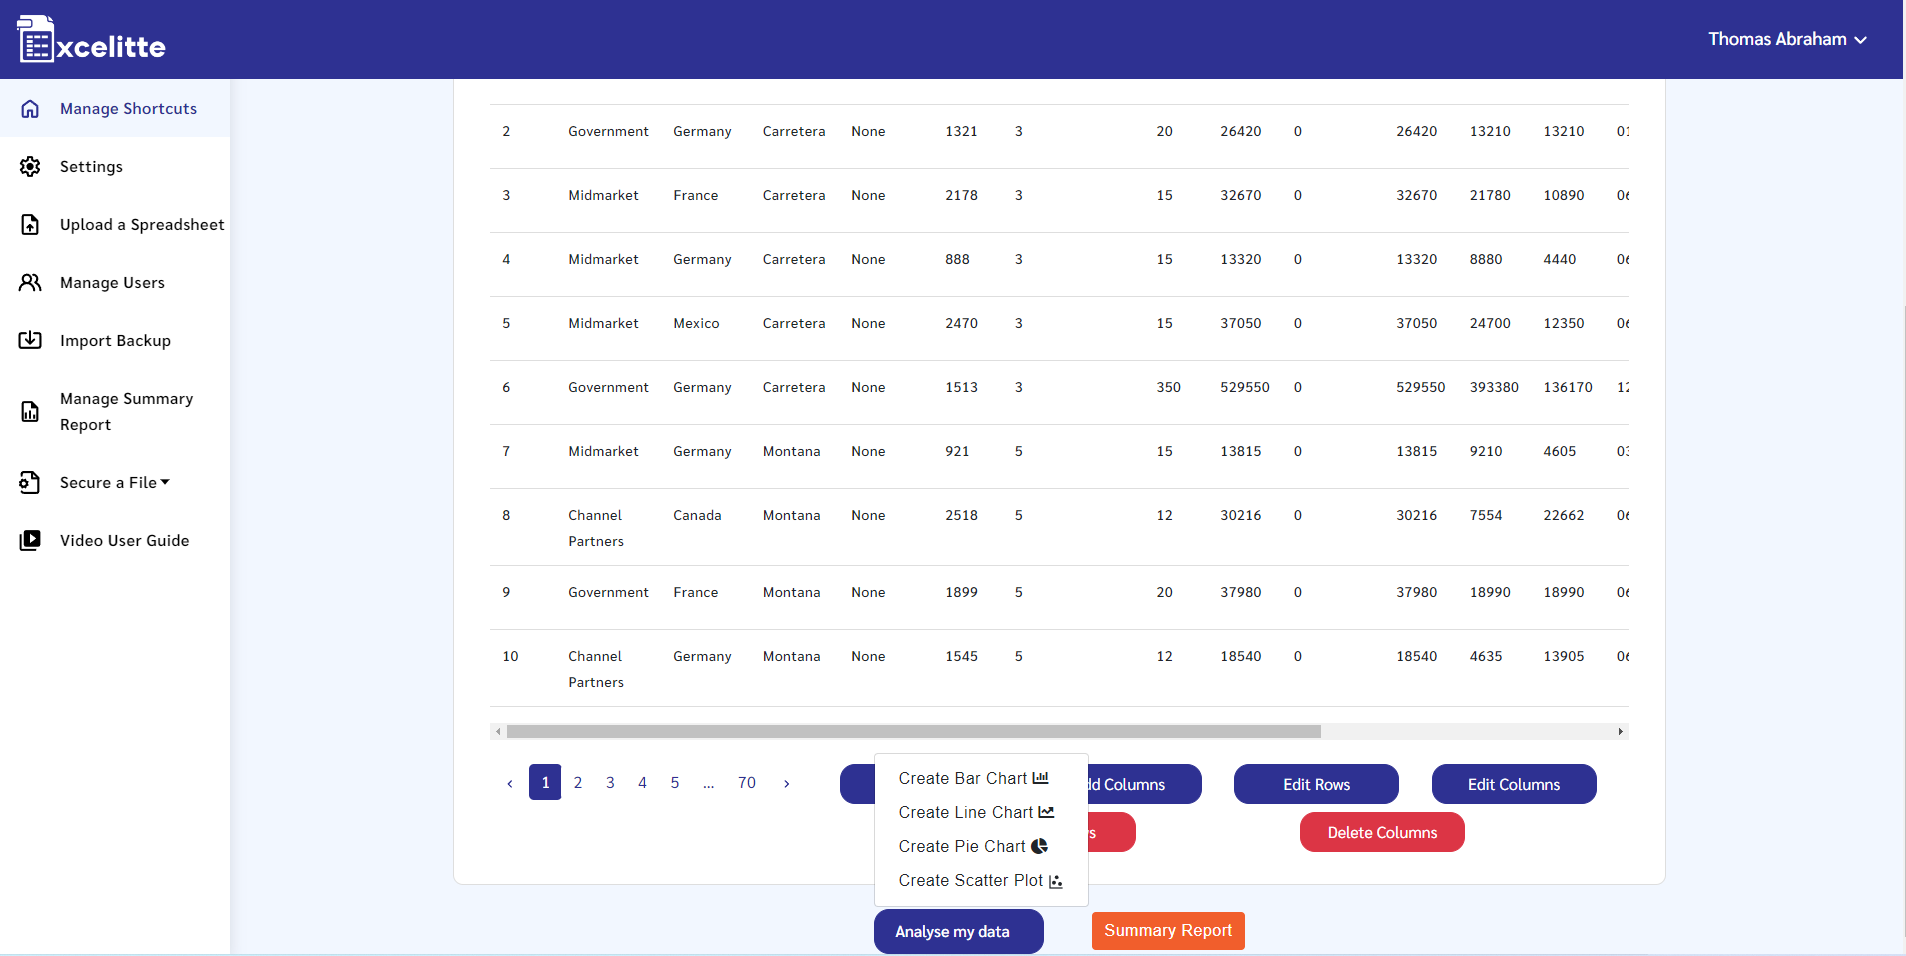
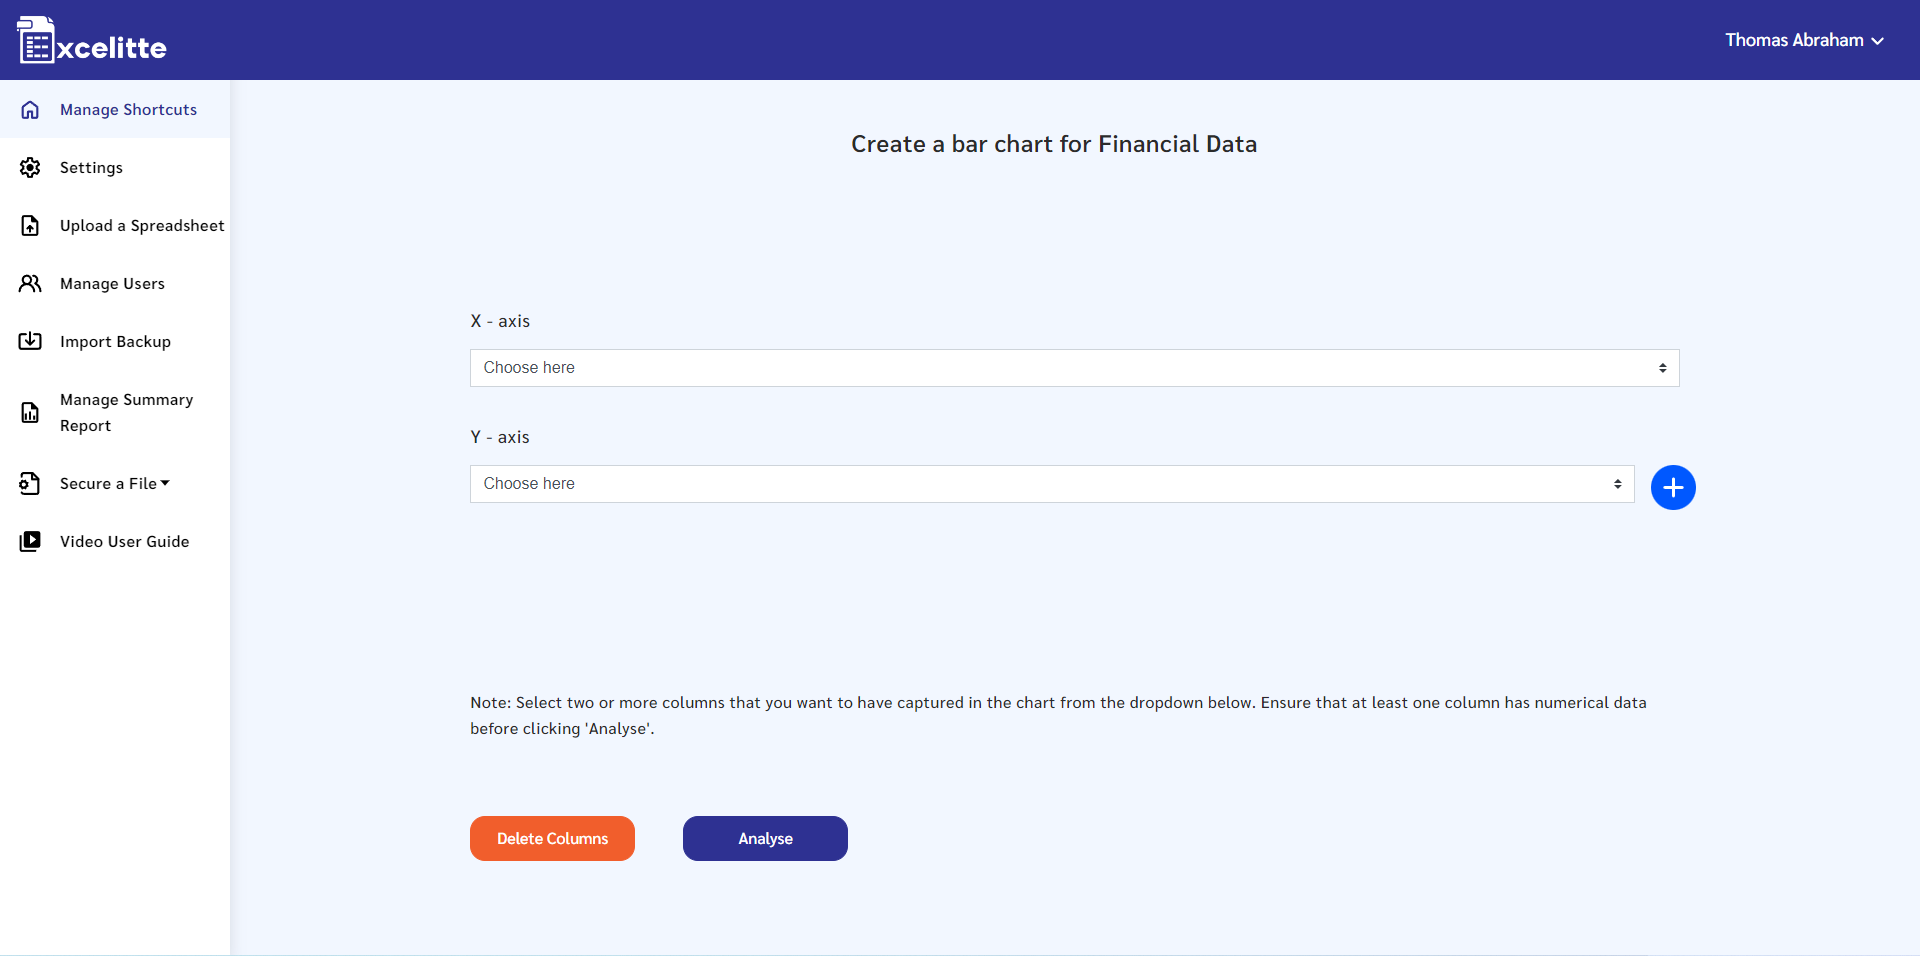
To view your data as a graphical chart, please do the following – Navigate to the "Manage Shortcuts" page, select your table shortcut and click on “Analyse my data”. A dropdown of different charts will appear for you to choose from.
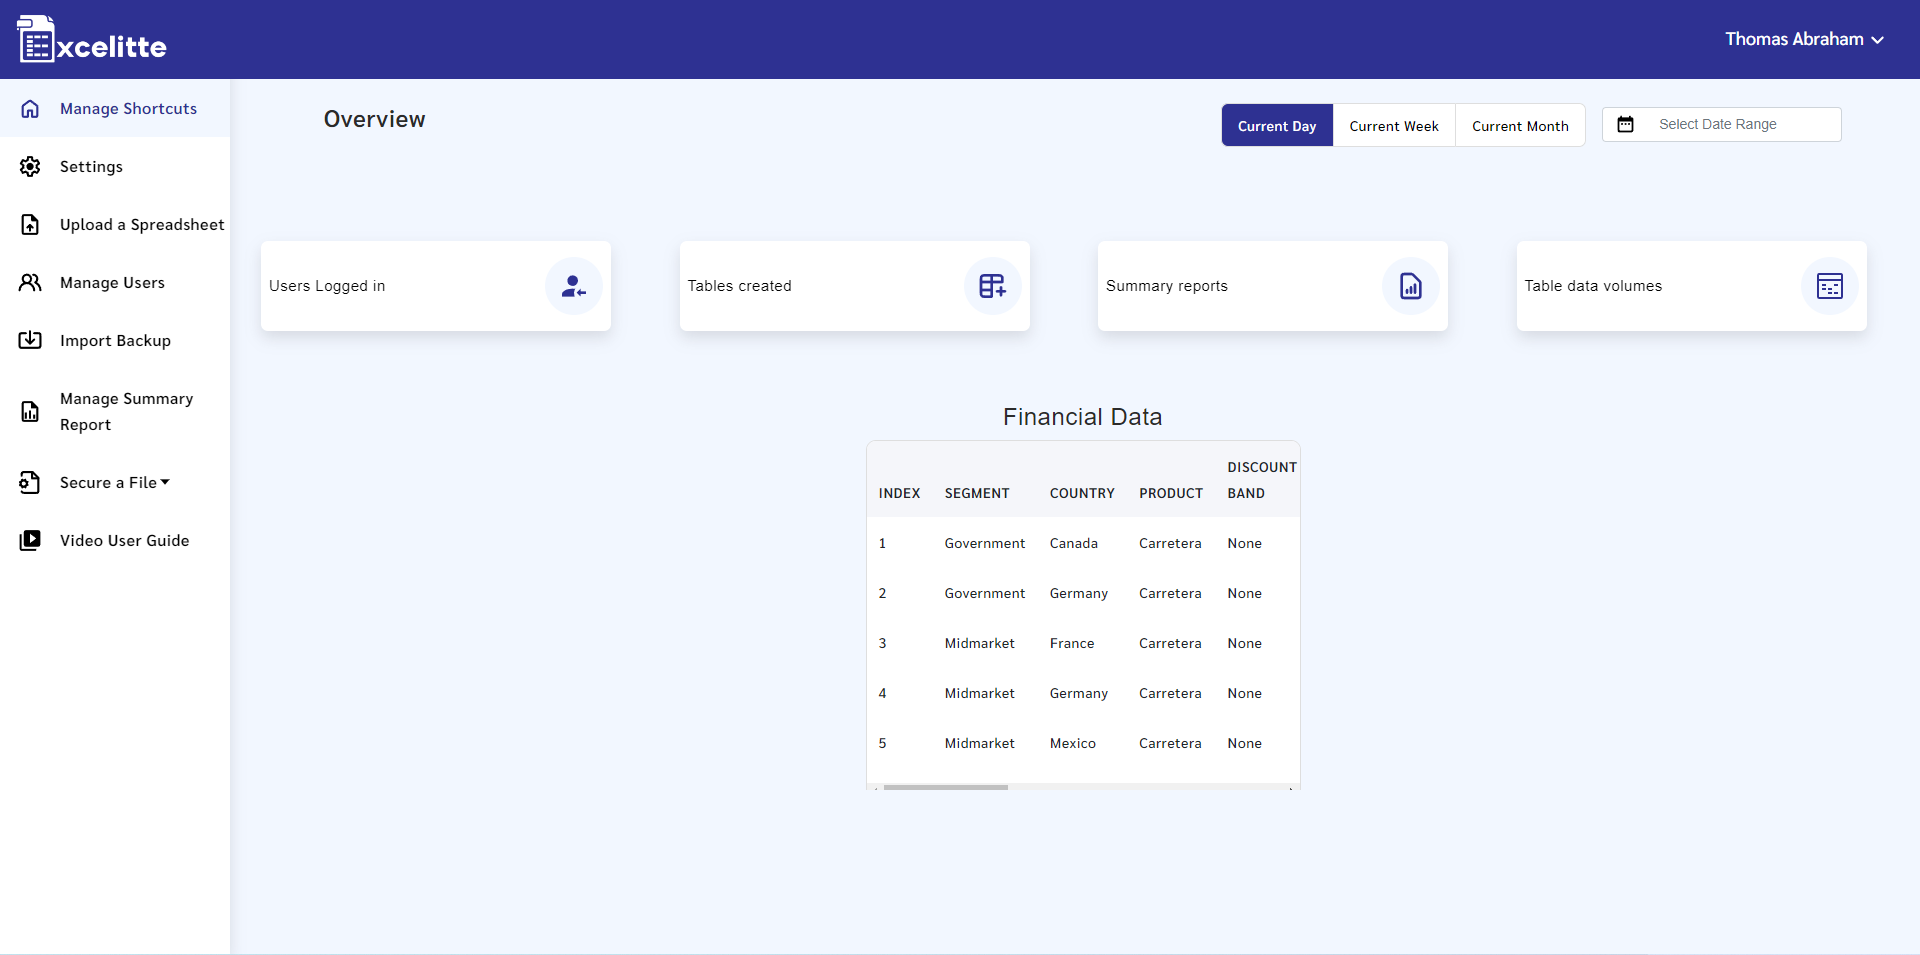
After selecting your chart of preference, follow the next few pages to view your data in the form of the selected chart type.
Please contact us via our website and we will arrange for one of our support engineers to reinstall Excelitte on your computer.
Your data is backed up automatically every week and sent to your admin user account email address. Please check your junk mail folder for this message and add the [email protected] to your email safelist. We strongly recommend that you create an email folder called backups and save at least four weeks back up emails in the folder to assist in recovering your data if we need to reinstall Excelitte.
The reports available in the admin dashboard are also captured from your weekly backup.
Excelitte can capture and manage any kind data on customers, products, logistics, delivery addresses, managing your stock & inventory, data generated from your daily business activities, and accounting data if other accounting tools are not already in use.